

Data visualization is a fun activity. It conveys meaningful information without straining the eyes. You don’t have to go through a long collection of letters in order to get the point. You can just view the visual and grasp what its trying to say — in a matter of seconds.
Kathmandu Living Labs (KLL) with support from Google, and under guidance from National Planning Commission, has published a visualization of Nepal Human Development Report 2014. You can compare the literacy rate, HDI (Human Development Index), population, life expectancy, average years of schooling, and per capita income of two or more districts, as well as of a district with the national average.

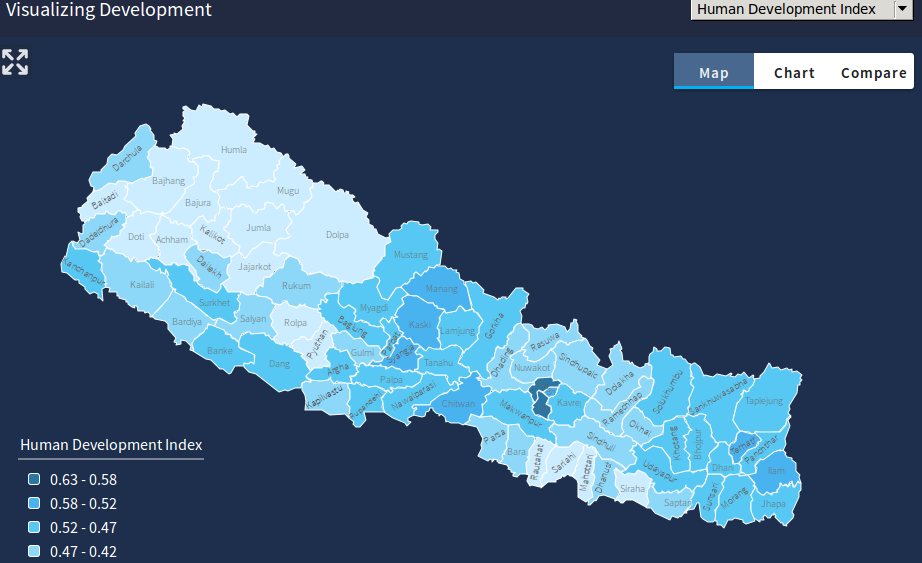
Here are some interesting facts that I have learned from the data:
- Nepal’s national average in Human Development Index is 0.490 (A HDI below 0.5 is considered to represent “low development”.)
- There are more females than males in our country. Our population is 2,64,94,504 (Male: 1,28,49,041 and female: 1,36,45,463).
- Average life expectancy is 68.80 years. People of Ramecchap live the longest with 72.9 yrs, and people in Dolpa live the lowest – for 61.2 yrs. Kathmandu is somewhere in the middle; Kathmandu residents have an average life expectancy of 68.55 yrs.
- Kathmandu is the most populated district with 17,44,240 people and Morang is second on the list with almost half of that : 9,65,370.
- Manang is the least populated district with 6538 people only, which may be the reason why it is also the district with the highest per capita income. Per capita income of Manang is 3,166, Kathmandu is 2,764 and Mustang is 1,922. This means that Manang has more wealthy people than Kathmandu. This must be because of the fact that there are only so few people compared with the dense population of Kathmandu, and most of them are involved in tourism.
- Kathmandu has the most literate people, whereas Sarlahi (38%), Mahottari (37.04%), Bara (43.25%), Dhanusha (41.89%), Mugu (39.25%), Humla (37.22%) has the lowest adult literacy rate. In Rautahat, the condition is worst with only 33.89% of literate people.
Thanks to Kathmandu Living Labs for visualizing our development. The same information would not have been as interesting to look at if it were not visualized.
One Comment
Leave a Reply
-
Moto G06 Power Gets Rs. 6,000 Pricier, But Can Its 7,000mAh Battery Save It?HIGHLIGHTS The Moto G06 Power price in Nepal is Rs. 24,999 (4/64GB). It features the…

-
Price Hike Alert!!! Redmi A7 Pro Now Costs Rs. 3,500 MoreHIGHLIGHTS Redmi A7 Pro price in Nepal starts from Rs. 21,499 for the 4/64GB variant.…
-
Redmi A7 Now Costs More than Rs. 20,000: Is It Still Worth It?HIGHLIGHTS Redmi A7 price in Nepal is Rs. 20,499 for the sole 3/64GB variant. The…


Pingback: KTMJS Developers Meetup #4 on 26th September, 2015 - Techलेख